

 USADA announced today that Don Ramos, of Colorado Springs, Colo., an athlete in the sport of Weightlifting, has tested positive for a prohibited substance and accepted a two-year suspension for his doping offense.
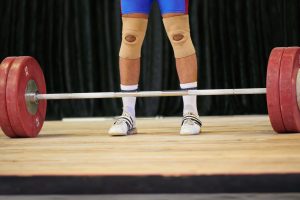
USADA was contracted to test the Pan American Masters Weightlifting Championships, which is an event for athletes 35 and older, in Chicago, Ill. June 14 – June 16, 2013. Ramos, 80, tested positive for the presence of a steroid of exogenous origin as the result of an in-competition urine sample collected on June 14, 2013 while he was attempting to set a world record. Anabolic Androgenic Steroids are prohibited under the USADA Protocol for Olympic and Paralympic Movement Testing and the International Weightlifting Federation (“IWF”) Anti-Doping Rules, both of which have adopted the World Anti-Doping Code (“Code”) and the World Anti-Doping Agency Prohibited List.
Ramos’s two-year period of ineligibility began on July 23, 2013, the date he accepted a provisional suspension. As a result of the violation, Ramos has been disqualified from all competitive results achieved on and subsequent to June 14, 2013, including forfeiture of any medals, points, and prizes.
In an effort to aid athletes, as well as all support team members such as parents and coaches, in understanding the rules applicable to them, USADA provides comprehensive instruction on its website on the testing process and prohibited substances, how to obtain permission to use a necessary medication, and the risks and dangers of taking supplements as well as performance-enhancing and recreational drugs. In addition, the agency manages a drug reference hotline, Drug Reference Online (www.GlobalDRO.com), conducts educational sessions with National Governing Bodies and their athletes, and proactively distributes a multitude of educational materials, such as the Prohibited List, easy-reference wallet cards, periodic newsletters, and protocol and policy reference documentation.
USADA is responsible for the testing and results management process for athletes in the U.S. Olympic and Paralympic Movement, and is equally dedicated to preserving the integrity of sport through research initiatives and educational programs.
For more information or media inquiries, click here.